


Project Goal
Plain-wear is a well-known clothing store. Because the fashion industry is changing so quickly, a store is sometimes temporarily closed to renovate it so that it is up-to-date again. Because it is a large company, it is sometimes difficult to see how stores are doing individually. Now the task is to create a system in which it can be kept track of when a store is (temporarily) closed. The CFO also wants to see how stores are performing. They got some problem and optimize trouble when using Excel now. We present for a team to make another version of data showing in Power BI Dashboard which match with their expectation and fix their issue when using excel. With combination of explicit point of IT and Business integrated into the project.
Progress Chart.
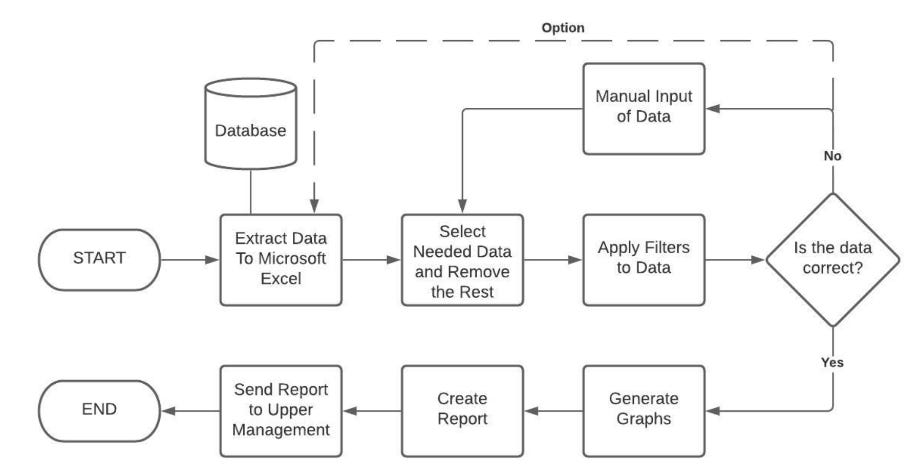
Project Scope
For this project, we must make a dashboard with loads of drill down options on the main data. We look at the Like4Like categorization the company uses. This means we compare stores based on their status; New store, Open store, Closed store, Re-fitted store. The most important thing is to have an easy-to-use dashboard in which the client can see how certain stores are doing based on revenue. It has to be easy and intuitive because everyone in the company will use this dashboard
Project Goal
Why I’m Building a Dashboard to Fix the Messy Data Problem at Plainwear
At Plainwear, I noticed something that kept slowing everyone down: almost all the store data was being tracked manually in Excel. Yup—spreadsheets everywhere. It might have worked in the early days, but now? It’s clunky, time-consuming, and way too easy to make mistakes.
I kept thinking, There has to be a better way.
So that’s exactly what I set out to create: a simple, clean dashboard where all the important store data lives in one place. No more copy-pasting, no more version mix-ups—just one clear view that anyone can use, anytime.
What I’m Working On
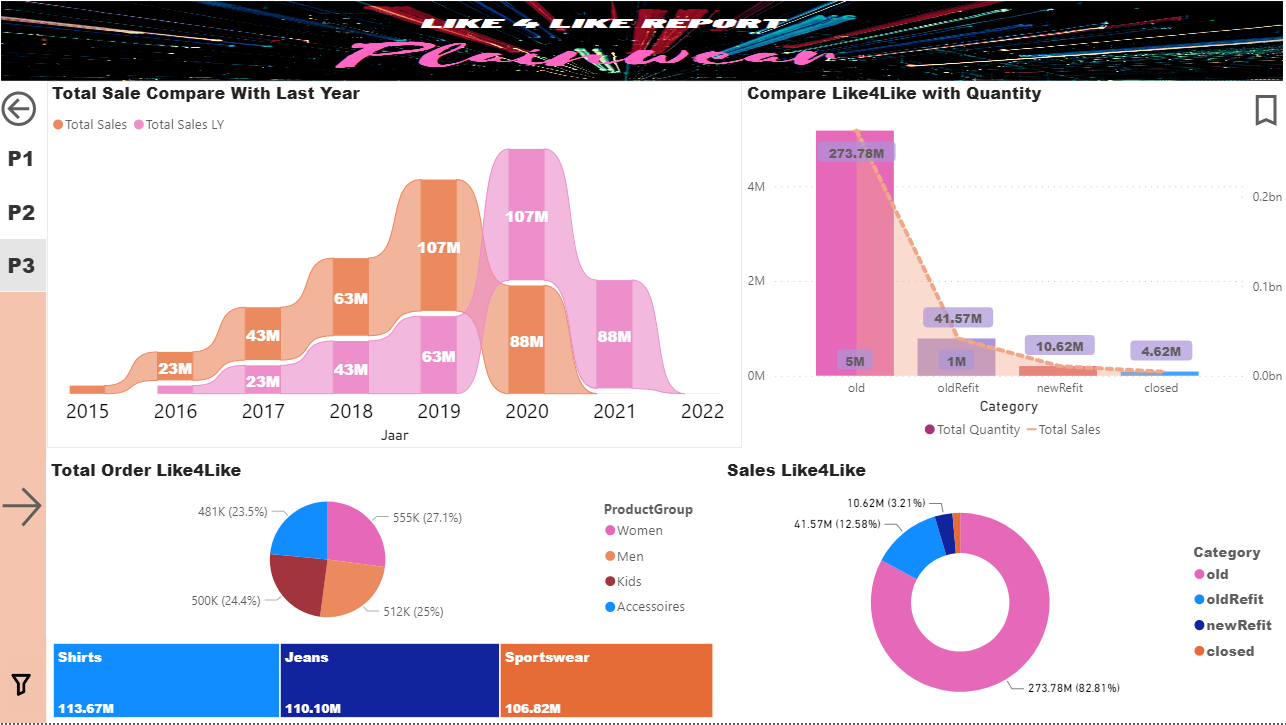
The idea is to build an easy-to-use Power BI dashboard that helps Plainwear employees see what’s going on across all stores—without having to open ten different Excel files.
I want to:
Save people time by automating as much as possible.
Make things super simple, so even those who aren’t tech-savvy can still use it comfortably.
Focus not just on the tech side, but on how people actually work—so the dashboard fits naturally into their daily routines.
My Bigger Goal
This isn’t just about building something fancy. It’s about making people’s jobs easier. I believe good tools should feel invisible—they just work. That’s what I’m aiming for with this project.
So, if you’ve ever struggled with messy data or felt stuck in Excel hell… I get it. I’ve been there. And I’m building this with you in mind.
Project Non-Deliverables / Out of scope.
The project non-deliverables are meant to display a list of processes/components that will NOT be included in our project/solution:
· Extensive IT solution (advanced functionality is not our priority).
· Any software that needs licensing.
· Only software solution, not hardware
· The full implementation of the project (Hiring employees and executing project)
· The assumption from us which haven’t verify by the client.
· Building the R solution and SQL server for the project.
· Focus on the technical part and abandon the business site of the project.
Management Overview
Being a group project, we set out to identify where our skills lie. After doing that, we wrote down our results alongside our desired outcomes of this project, which assisted in setting out goals for acquiring new skills. To utilize our management skills, we set up a step by step task implementation plan, through which we can monitor our progress.